
Figure 6.
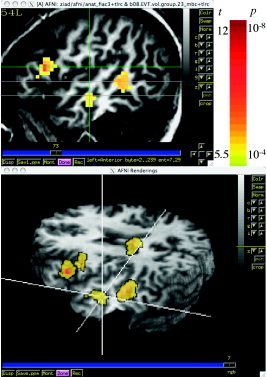
Areas showing interaction between sentence and speaker effects. The areas colored in red show significant effects for SSp (DSt > SSt). The slice view shows the location of the three clusters in the left hemisphere. The 3‐D rendering shows the pattern of interaction in the entire brain. The viewpoint is from the left hemisphere and the crosshair, linked to the one in the axial slice, and goes through the bilateral middle temporal clusters. In this view the color overlay “shines through” the brain, as if the brain were translucent. (Skull stripping was performed with the AFNI program 3dSkullStrip.) Talairach coordinates of the clusters' centers of mass are in Table I.