
Figure 3.
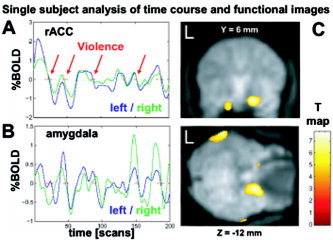
Single‐subject analysis with time course of exemplary raw data at the rACC (A) and the amygdala (B) as compared to violent scenes (marked with red lines). Regardless of the noise, dips after each violent event are clearly delineated. C: Overlay of BOLD signal changes at the level of the amygdala of a single subject on its EPI data. The (unsmoothed) EPI shows a low amount of dephasing and the overlaid activation is clearly located within the right amygdala in this subject.