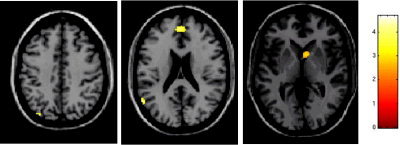
Figure 5.

Random effect analysis showing, on a high‐resolution T1‐weighted image in the standard SPM space (neurological convention), regions of relative increased cortical activations (color‐coded for t‐values) in healthy individuals during the performance of cyclic flexion‐extension of right dominant hand and foot with the right upper limb positioned behind vs. in front with respect to the trunk. Several areas are visible located in the frontal, parietal and temporal lobes, and the caudate head.
