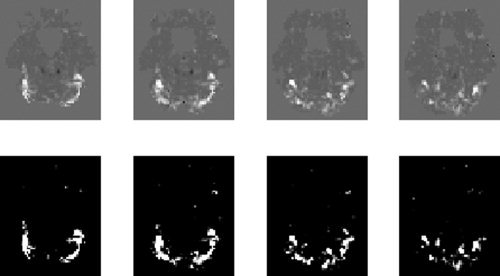
Figure 10.

Average effect of faces: The top row shows maps of the difference in contributions to the log evidence, Un(2)−Un(1), for slices z = −24, −21, −18 and −15 mm. The bottom row shows the same map but thresholded so that only effects with a posterior probability greater than 0.999 (difference in log evidence = 4.6) survive.
