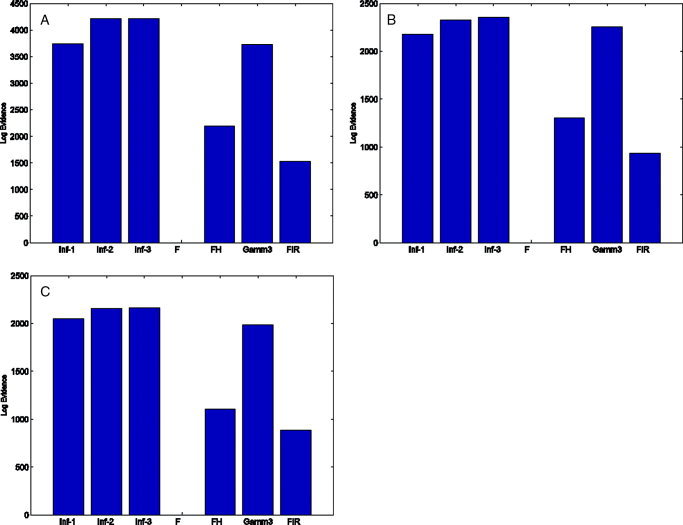
Figure 12.

Comparing hemodynamic basis sets: The bar plots show the log‐evidence for each hemodynamic basis set for COIs in (a) LOC x = −45, y = −60, z = −24 mm, (b) ROC x = 45, y = −66, z = −24 mm and (c) Sensorimotor Cortex x = 36, y = −9, z = 66 mm. The evidence values have been normalised (by subtraction) so that the minimal log‐evidence is zero. [Colour figure can be viewed in the online issue, which is available at www. interscience.wiley.com.]
