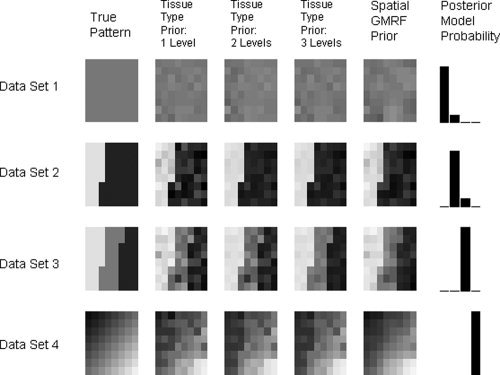
Figure 4.

AR(1) images for synthetic data: Each row in this figure corresponds to analysis of a different data set. The leftmost column shows the AR(1) profile used to generate the data. The second, third and 4th columns show AR profiles as estimated by models with tissue‐type priors having 1, 2 and 3 (known) discrete levels, respectively. The fifth column shows the estimated profiles from models with spatial GMRF priors. The final column shows bar plots of the posterior model probabilities. The first three bars correspond to models with tissue‐type priors having 1, 2 and 3 levels and the fourth bar corresponds to the spatial GMRF model. These results show that our approximation to the model evidence can correctly detect the type of structure in the coefficients.
