Figure 5.

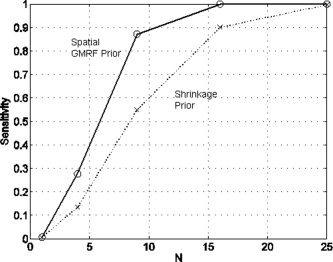
COI analysis for a uniformly activated region: The figure shows of a plot of sensitivity versus number of voxels in the cluster, N, for models using a spatial prior (circles and solid line) and a shrinkage prior (crosses and dotted line).

COI analysis for a uniformly activated region: The figure shows of a plot of sensitivity versus number of voxels in the cluster, N, for models using a spatial prior (circles and solid line) and a shrinkage prior (crosses and dotted line).