
Figure 6.
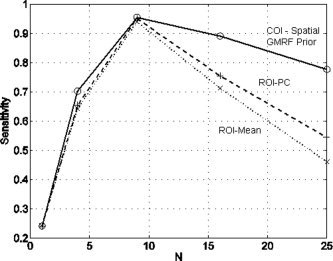
COI analysis for a non‐uniformly activated region: The figure shows of a plot of sensitivity versus number of voxels in the cluster, N, for a model using a spatial prior (circles and solid line), ROI analysis using the mean voxel time series (crosses and dotted line) and an ROI analysis using the principal component time series (plusses and dashed line).