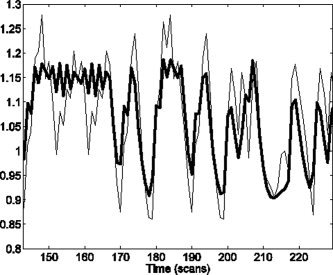
Figure 7.

Noise‐free time series: From type 2 data (thin line), generated from an FIR model, and type 1 data (thick line), generated from a best fitting Informed basis set model. These data were used to compare the sensitivity of nested versus non‐nested model comparison, in the context of selecting an optimal hemodynamic basis set.
