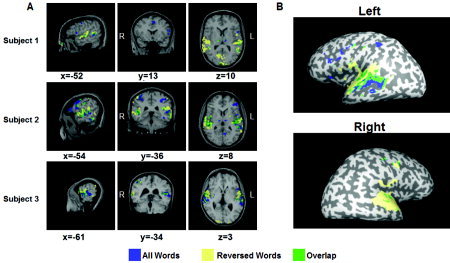
Figure 3.

Activation contrast (all words vs. reversed words). Areas activated during real‐words (verbs or nouns) conditions are marked in blue. Areas activated during reversed‐words conditions are marked in yellow. Overlapping areas are marked in green. A: Variance in individual activations is demonstrated in three subjects. The activation is shown on structural anatomy images of each of the subjects. Regions of interest were defined as blue activations in anatomical predefined areas for each subject separately. B: Multisubject activation superimposed on inflated brain images of one of the subjects. General linear model (GLM) for 13 subjects, P < 0.01, uncorrected.
