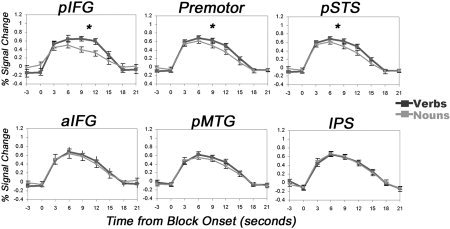
Figure 4.

Verb‐noun effects in regions of interest. Mean percent signal change during verb and noun blocks in the six regions of interest on the left hemisphere. Data are averaged across 14 subjects and 8 blocks. Time courses for verbs are denoted in dark gray, nouns in light gray. Error bars show the standard error of the mean (across subjects) in each time point. *Significant (P < 0.05) effect.
