
Figure 1.
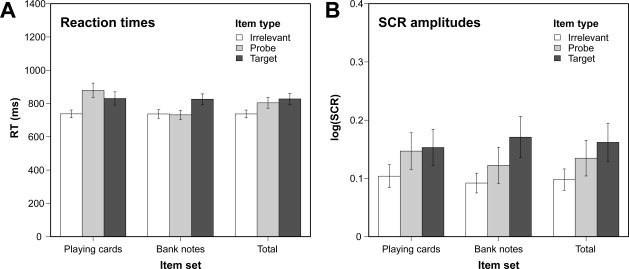
Reaction times (panel A) and log‐transformed skin conductance response (SCR) amplitudes (panel B) as a function of item category and item type. Additionally, mean values across item categories are displayed. Error bars indicate standard errors of the mean.