
Figure 2.
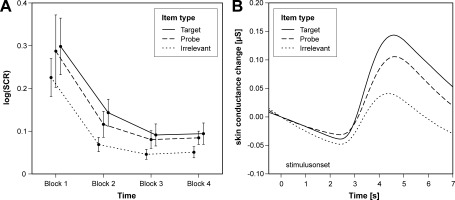
Skin conductance changes as a function of item type. Panel (A) shows the temporal course of the log‐transformed skin conductance response (SCR) amplitudes across the experiment. Panel (B) displays the grand average of the SCRs in microSiemens as a function of item type. The skin conductance changes were computed as differences to the corresponding value at stimulus onset.