
Figure 4.
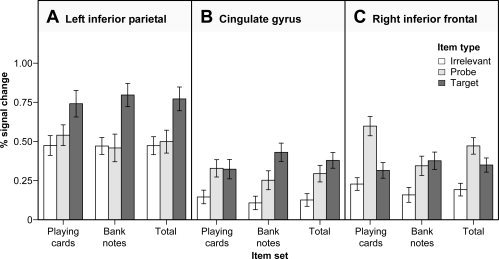
Mean percentage signal change in the left inferior parietal lobule (panel A), the cingulate gyrus (panel B) and the right inferior frontal gyrus (panel C) as a function of item category and item type. The regions of interest were functionally defined by the main effect of item type. Mean values across item categories are displayed on the right side of each panel. Error bars indicate standard errors of the mean.