
Figure 3.
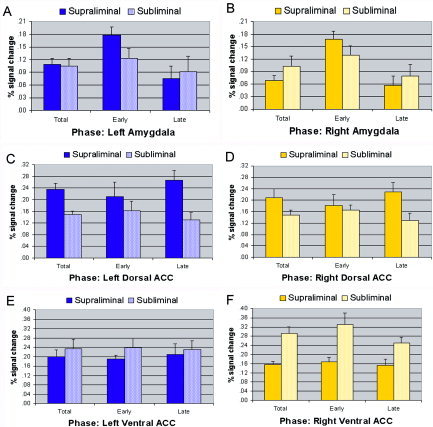
The percentage blood oxygenation level‐dependent (BOLD) signal change and standard error for supraliminal and subliminal fear, relative to a neutral baseline, for the regions of interest: left (A) and right (B) amygdala, and both left (C) and right (D) dorsal portions of the anterior cingulate cortex (ACC) and left (E) and right (F) ventral portions of the ACC. In each graph, bars depict signal change for the full experimental time course (total), and for the early and late phases of the time course. The total percentage signal change is included as a frame of reference to findings from image analyses. [Color figure can be viewed in the online issue, which is available at www.interscience.wiley.com.]