
Figure 1.
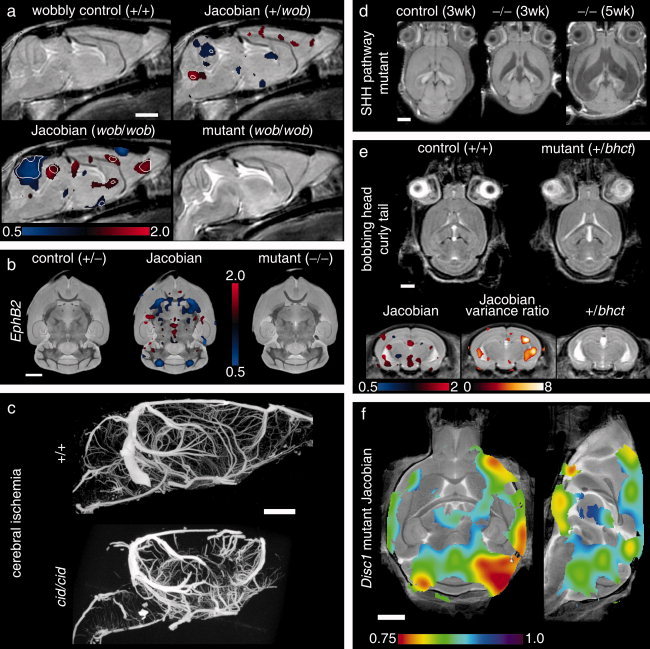
Neuroimaging findings in mouse mutants. Selected mouse mutants from Table I illustrate neuroimaging phenotypes and imaging protocols. In (a), an average control mouse image is shown with two Jacobian overlays indicating local volume changes in the heterozygous and homozygous wobbly mutants. Values greater or less than unity in the Jacobian field represent growth or shrinkage, respectively. Jacobian overlays in panel (a) are shown in regions where P < 0.05 with white contour lines indicating P = 0.002 (a false discovery rate of 5% in the homozygous mutant). The average homozygous wobbly mutant image is also shown for reference and exhibits a small cerebellum. In (b), data from the EphB2 knockout study indicates an abnormality at the anterior commissure (the posterior portion is absent). Jacobian data in the middle image indicate regions where P < 0.003 (5% false discovery rate). Panel (c) shows two sample micro‐CT data sets as maximum intensity projections. The cerebral ischemia mutant shows a striking defect in vascular perfusion as compared to the control. Panels (d) and (e) provide two examples of hydrocephalus. Three different individual images from the sonic hedgehog pathway mutation are shown (d) with massive expansion of the ventricles (shown as hypo‐intense regions). In panel (e), control and mutant averages from the bobbing head study show more subtle ventricle expansion (shown as hyper‐intense regions). In this case, statistical comparison of the mutant Jacobian values to a set of 20 control mice (four wildtype littermates supplemented with non‐littermate wildtypes) shows expanded ventricles (regions indicate a 5% false discovery rate) and increased variability at the lateral ventricles (Jacobian variance ratio is shown in regions where P < 0.05). In the final panel (f), regions of abnormality representative of the disrupted‐in‐schizophrenia‐1 mutants (Disc1) are shown as Jacobian data overlaid on an average image (regions indicate P < 0.05 by a Mann–Whitney U test). All white scale bars indicate 2 mm. Color scales are indicated in panels (a), (b), (e), and (f) for the respective overlays. Data were acquired with in vivo magnetic resonance imaging (MRI) (panels a, d, and e), ex vivo specimen computed tomography (c), ex vivo specimen MRI (d), and in situ specimen MRI (f). All MRI images are single slices from three‐dimensional isotropic data sets.