
Figure 7.
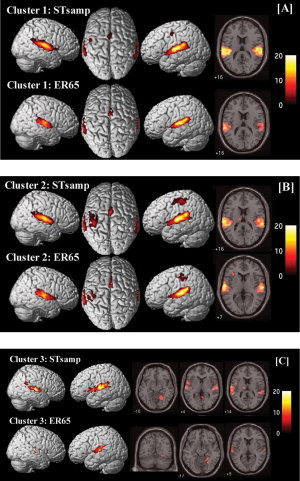
Imaging results for the cluster analysis for STsamp and ER65 (P < 0.05, corrected for multiple comparisons (FWE)) (A) cluster 1 (ITP0‐1), (B) cluster 2 (ITP2‐3), (C) cluster 3 (ITP4‐5). Cluster 4 did not reveal significant voxels for this threshold. 3D‐rendered images (left) and axial slices (right) are selected based on regions activated in experimental designs as shown in Table II. [Color figure can be viewed in the online issue, which is available at www.interscience.wiley.com.]