
Figure 1.
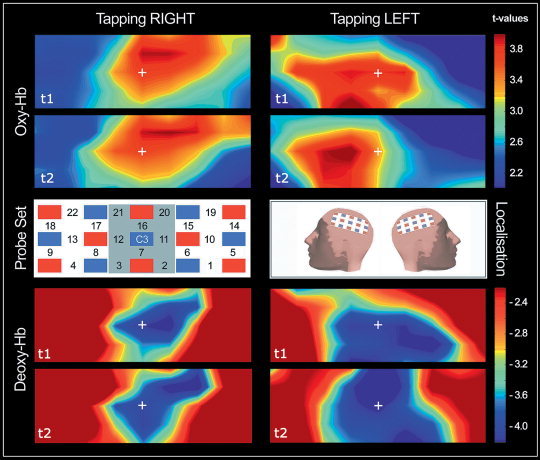
The channel scheme of the probe sets is shown in the middle row/left. Note that only one probe set is displayed (localized over the left hemisphere). Note that the channel numbering of the second probe set over the right hemisphere (not shown) is horizontally mirror‐inverted. Red squares represent light emitters, whereas blue squares are detectors. The region of interest (ROI) is gray shaded. The middle row/center optode is placed over C3/C4 according to the international 10‐20 system as shown in the middle row/right (“localization”). The activation maps are color‐coded t‐values obtained from the group analyses. The measurement sessions are indicated by “t1” and “t2.” Results of O2Hb for right and left finger tapping are shown in the upper panel (“Oxy‐Hb”). The HHb (“Deoxy‐Hb”) results are displayed in the lower panel. Note that the maps are second‐level group maps and based on interpolations from single channels.