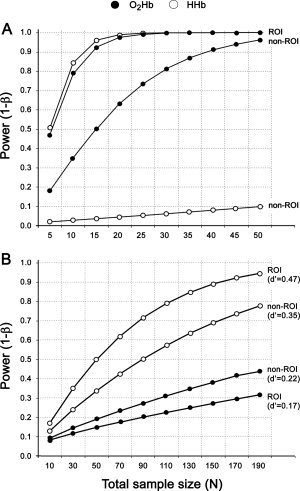
Figure 2.

A posteriori power analysis of the activation vs. baseline contrasts for O2Hb and HHb (A). The analyses are separated by channels of the predefined ROI and channels outside the ROI (non‐ROI). Given the sample size of n = 12 both NIRS parameters show sufficient statistical power (power >0.80). Note that the alpha level is corrected. B: The effect sizes for the intersession amplitude differences. Statistical power is plotted vs. total sample size given the upper extreme effect size values at the ROI and the non‐ROI level due to randomly occurring intersession amplitude differences. Note that the power analyses for dependent samples are based on an uncorrected alpha level of 0.05.
