
Figure 3.
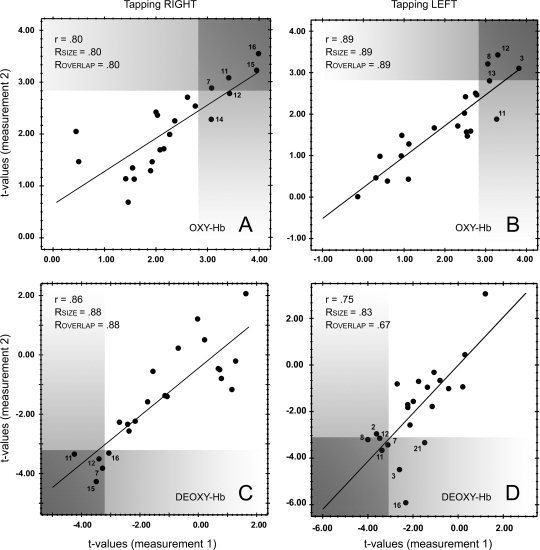
Scatterplots of the t‐values for O2Hb are shown in A (right finger tapping) and B (left finger tapping). Similarly, the HHb data is shown in C (right finger tapping) and D (left finger tapping). The gray shaded areas represent t‐value ranges of statistical significance. Reproducibility indices are shown in the upper left corner of each scatterplot. Channels that exhibit significant activation are labeled with the channel number (compare to Fig. 1 “probe set”).