
Figure 4.
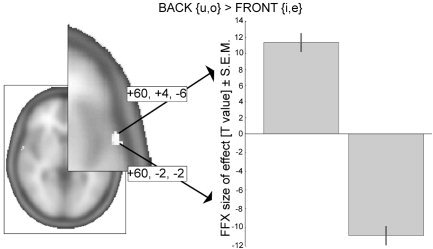
Direct statistical comparison of Back vowel to Front vowel activation. Given are t‐values (P < 10−11) for the clusters in the fixed‐effects (FFX) model that survived small‐volume correction for the “all‐vowels > band‐passed noise” comparison derived from the random‐effects model (shown in the right‐hemispheric brain activation; right panel). The two clusters differ largely along the posterior–anterior axis (Montreal Neurological Institute coordinates).