Abstract
We determined connectivity of the human brain using functional magnetic resonance imaging (fMRI) while subjects experienced auditory stimuli in a 2‐by‐2 factorial design. The two factors in this study were “speaker” (same or different speaker) and “sentence” (same or different sentences). Connectivity studies allow us to ask how spatially remote brain regions are neurophysiologically related given these stimuli. In the context of this study, we examined how the “speaker” effect and “sentence” effect influenced these relationships. We applied a Bayesian connectivity method that determines hierarchical functional networks of functionally connected brain regions. Hierarchy in these functional networks is determined by conditional probabilities of elevated activity. For example, a brain region that becomes active a superset of the time of another region is considered ascendant to that brain region in the hierarchical network. For each factor level, we found a baseline functional network connecting the primary auditory cortex (Brodmann's Area [BA] 41) with the BA 42 and BA 22 of the superior temporal gyrus (STG). We also found a baseline functional network that includes Wernicke's Area (BA 22 posterior), STG, and BA 44 for each factor level. However, we additionally observed a strong ascendant connection from BA 41 to the posterior cingulate (BA 30) and Broca's Area and a stronger connection from Wernicke's Area to STG and the posterior cingulate while passively listening to different sentences rather than the same sentence repeatedly. Finally, our results revealed no significant “speaker” effect or interaction between “speaker” and “sentence.” Hum. Brain Mapp, 2006. © 2006 Wiley‐Liss, Inc.
Keywords: fMRI, functional connectivity, effective connectivity, semantic processing, phonological processing
INTRODUCTION
The study of language‐related regions of the human brain is well into its second century. Throughout the years a commonly accepted model of language organization has emerged. The model proposes a region of the frontal cortex as critical for formulating and accomplishing speech, while a separate area for phonologic and semantic processing of language is located in a posterior area [Broca, 1861; Wernicke, 1874]. More recently, Binder et al. [ 1997] used functional magnetic resonance imaging (fMRI) to show that cortical activation associated with language processing persists in the frontal, temporal, and parietal lobes of the left hemisphere. Moreso, they find significant activation associated with language in the middle temporal, inferior temporal, fusiform, and angular gyri. fMRI measures localized changes in blood oxygenation, a surrogate of neural activity, from which we are able to determine localized regions of brain activity [Ogawa et al., 1990].
Traditional activation studies, such as that of Binder et al. [ 1997], focus on determining distributed patterns of brain activity associated with specific tasks. However, we may be able to more thoroughly understand language processing by studying the interaction of distinct brain regions, as a great deal of neural processing is performed by an integrated network of several regions of the brain.
fMRI allows us to examine relationships between spatially distinct regions of the human brain. These relationships can be described in terms of functional connectivity, defined by Friston et al. [ 1993] as the “temporal correlations between spatially remote neurophysiological events.” We used a method introduced by Patel et al. [ 2006] that not only determines functional relationships between spatially remote brain regions, but also determines a hierarchical relationship between brain regions based on whether one region exhibits elevated activity a subset of the time that the other region exhibits task‐induced elevated activity. Through a measure of hierarchy and a separate measure of functional connectivity, Patel et al. [ 2006] define hierarchical functional networks in a data‐driven fashion that does not require prespecification of a set of brain regions from which networks can be determined.
Figure 1 presents a schematic illustration that conceptually describes a functional network of four brain voxels generically labeled as w, x, y, and z. Although Figure 1 describes a network of only four voxels, we are able to apply our methodology to the set of all intracranial voxels. We used shading to denote a voxel exhibiting elevated activity (an elevated functional MR signal) and all connecting bars are potentially bidirectional. In our model, we employ our fMRI data to construct a binary map that indicates whether each voxel exhibits elevated activity at a given time point. Voxels w and z become active together and inactive together; thus, we consider them functionally connected, as sister voxels in the hierarchical network. Given some positive functional connectivity between voxel a and voxel b, if a exhibits elevated activity for a subset of the period in which b exhibits elevated activity, we consider b to be ascendant to a in the hierarchical network consisting of b and a. In Figure 1, while x, y, and w are functionally connected, voxels x and y exhibit elevated activity to a subset of the stimuli for which w exhibits elevated activity, suggesting that w is ascendant to x and y in our hierarchical functional network. w can be thought of as a central node in the network.
Figure 1.
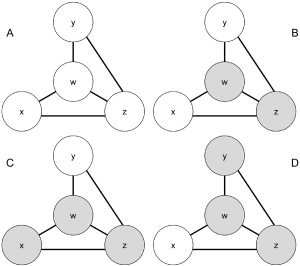
Functional network consisting of functionally connected brain voxels, w, x, y, and z. Shading for a given voxel indicates elevated activity. w and z are ascendant to x and y,; thus, x and y can be thought of as satellite voxels to the central voxels, w and z. A, B, C, and D represent different time points in the voxel time series of w, x, y, and z.
Our experimental protocol follows a 2 by 2 factorial design: a factor “speaker” (same or different speaker) and a factor “sentence” (same or different sentences). The main questions of interest are about the main effect of “speaker” and the main effect of “sentences,” and their interactions. Subjects were asked only to listen attentively to sentences, eyes closed, and to lay still in the scanner. They were told that they would be asked to tell whether some sentences were presented during the experiment after scanning. Thus, in this article we determine hierarchical functional networks associated with auditory language processing. Through these networks we may be able to better describe how spatially remote brain regions interact and cooperate to perform certain tasks involving phonological and semantic processing.
Data
The data analyzed here are the Functional Image Analysis Contest (FIAC) dataset. Details of the experimental paradigm and acquisition parameters are given in Dehaene‐Lambertz et al. [ 2006].
Due to incomplete data or head motion during scanning (we required less than 1 mm head movement in any direction and less than 1° head rotation in any direction), we only used data from 11 subjects for our analysis. Let M indicate the number of scans per run and S indicate the total number of runs (2 × 11 subjects).
We preprocessed all of the data using SPM2 (http://www.fil.ion.ucl.ac.uk/spm/) by initially performing motion correction of images to the first functional scan within subject using a 6‐parameter rigid body transformation and subsequently spatially normalizing the realigned images to the Montreal Neurological Institute (MNI) template by applying a 12‐parameter affine transformation followed by nonlinear warping using basis functions [Ashburner and Friston, 1999]. We bypassed spatial smoothing to avoid further inducing non‐neurophysiologically related spatial correlation.
MATERIALS AND METHODS
Determining Hierarchical Functional Networks
We give a concise description of the hierarchical functional network connectivity method in the following paragraphs and ask the reader to refer to Patel et al. [ 2006] for details. We begin by constructing a general linear model that takes the form:
| (1) |
for each subject's voxel time series, where Y M×1 is a column vector of the global mean adjusted functional MR signals for a single voxel. The columns of X model the effects of interest, in this case the auditory stimulus, while the columns of H model confounding effects. K M×p is a discrete cosine transform matrix with p harmonic periods up to, in our case, 62 seconds. K adjusts for possibly confounding low‐frequency trends in the data. W is a “pre‐whitening” matrix generated from an estimate of the matrix, V, of the intrinsic autoregressive correlation between εi and εj, where W′W = V −1 [Marchini and Smith, 2003].
We define elevated activity in a voxel due to effects of interest by determining whether the data, adjusted for all known confounds, exceeds a given threshold. Specifically, we denote R = WY − K
 − WH
− WH
 and define a vector of binary values for indicating whether elevated activity occurs for each scan, with respect to a constant c, by:
| (2) |
where σ2 is the variance of W × ε. A is a column vector, where the mth element is 1 if the corresponding element of R is larger than c × σ; and the mth element of A is 0 otherwise. Our method defines a voxel as active if the associated level of activity is c standard deviations above what is expected under the null hypothesis that β = 0. Larger values of c identify voxels with more elevated levels of activity. We chose c = 1 when analyzing this auditory stimuli data.
We fit model (1) separately for all V voxels and for each of the S subjects. Let A vsm be the indicator for elevated voxel activity as defined above for voxel v, subject s, and measurement m, and let R vsm indicate the corresponding level of activity. R v indicates the entire time‐series for voxel v adjusted for all known confounds.
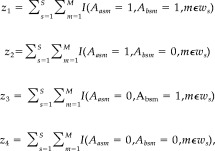
Subsequently, we construct a bivariate Bernoulli Bayesian model for the joint activation of each pair of brain voxels using a multinomial likelihood with a Dirichlet prior distribution. Given some experimental context, w, the data we considered to model the joint activation probability for voxels a and b can be expressed as:
 |
(3) |
For i = 1…4, where w s is the set of measurements taken under experimental context w for subject s, and I(.) is the indicator function. z 1 is interpreted as the number of times that both a and b experience an elevated fMRI signal over each measurement in experimental context w of each run of each subject. The multinomial likelihood of our data takes the form:
| (4) |
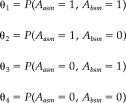
where the elements of θ are defined as:
 |
(5) |
for any subject s and measurement m ε w s
We assume each repeated measure on the same voxel pair is independent over time and across runs.
Following a Bayesian formulation, we express our prior belief about θ by defining a Dirichlet prior that takes the form:
| (6) |
where all θ i ≥ 0 and ∑ θi = 1. Our posterior distribution, p(θ|z,w), is Dirichlet with parameters γ i = α i + z i − 1 for i = 1…4. In this study, we used the flat prior, α 4×1 = 04×1, for each intracranial voxel pair and each experimental context.
Our interpretation of functional connectivity and the hierarchical nature of the connectivity (i.e., ascendancy) stems from Figure 1. As the relative difference between P(A a | A b) and P(A a) increases and, conversely, the relative difference between P(A b | A a) and P(A a) increases, the less independent and more functionally connected the two voxels are. Our functional connectivity metric allows us to determine ascendancy between a and b by the ratio of their respective marginal activation probabilities given significant functional connectivity between the two. Specifically, for two functionally connected voxels a and b, we say that a is ascendant to b whenever the marginal activation probability of a is larger than that of b. Our measure of functional connectivity suggests that voxels with vastly different probabilities of elevated activity can be functionally connected in the circumstance that one voxel becomes activated a subset of the time that the other becomes active.
Descriptive and Inferential Methods
We describe the functional connectivity and ascendancy between each pair of brain voxels by functions of Θ, which defines the joint distribution of elevated activity between two voxels, measured dichotomously.
Functional Connectivity
We develop a measure of association, κ, to describe functional connectivity based on the posterior distribution, p(θ|z,w), by considering a 2 × 2 table (Table I) with fixed marginal activation probabilities. κ, which ranges from −1 to 1, given a fixed pair of marginal activation probabilities, is defined as follows:
| (7) |
where E = (θ1 + θ2)(θ1 + θ3), max(θ1) = min((θ1 + θ2,θ1 + θ3), min(θ1) = max(0,2θ1 + θ2 + θ3 − 1) and
 |
(8) |
The numerator of κ measures the difference between the joint activation probability and the expected joint activation probability under independence, while the denominator is simply a weighted normalizing constant forcing κ to range from −1 to 1. Thus, κ close to either −1 or 1 suggests a strong dependence or functional connectivity between the voxel pair. min(θ1 + θ2, θ1 + θ3) represents the maximum value of P(A a,A b) given P(A a) and P(A b), while max(0,2θ1 + θ2 + θ3 − 1) represents the minimum value of P(A a,A b) given P(A a) and P(A b).
Table I.
Joint activation probabilities for voxels a and b
| Voxel a | |||
|---|---|---|---|
| Active | Inactive | ||
| Voxel b | |||
| Active | θ1 | θ3 | θ1 + θ3 |
| Inactive | θ2 | θ4 | θ2 + θ4 |
| θ1 + θ2 | θ3 + θ4 | 1 | |
We are able to obtain an estimate of p(κ|z,w) through sampling of the posterior Dirichlet distribution, p(θ|z,w). We conduct Bayesian inference on κ by estimating P(κ > e) > p, where e is a given effect size and p is a given probability cutoff. We estimate P(κ > e) > p by sampling from p(θ|z,w), calculating κ from each sample, and determining the proportion of samples for which κ > e.
Ascendancy
Given that voxels a and b are functionally connected (κ is significantly different from 0), we can interpret a measure of ascendancy based on the ratio of P(A a) and P(A b). Our measure of ascendancy, τ ab, takes the following form:
 |
(9) |
τ ab ranges from −1 to 1. Given κ ≠ 0, a positive value of τ ab indicates that a is ascendant to b, while a negative value of τ ab indicates that b is ascendant to a. κ is defined in such a way that if a exhibits elevated activity a subset of the time for which b exhibits elevated activity, then κ = 1. Thus, κ and τ ab must be jointly interpreted to determine ascendancy. We are able to obtain an estimate of p(τ|z,w) by sampling from the posterior Dirichlet distribution, p(θ|z,w), and subsequently conduct inference on τ by estimating P(τ > e) > p in a similar manner to the estimation of P(κ > e) > p.
RESULTS
Auditory Language Processing Results
This study focuses on determining the effect of speaker and sentence on hierarchical functional networks involved in auditory language processing. We consider functional networks that include regions involved in early auditory processing, as well as semantic processing, the primary auditory cortex (AI), Wernicke's Area (Brodmann's Area [BA] 22p), and BA 39, as suggested by Binder et al. [ 1997]. For each of the four factor combinations, we determine posterior distributions of κ and τ between each intracranial voxel and a voxel within the primary auditory cortex as well as between each intracranial voxel and a voxel within Wernicke's Area and again, similarly, for BA 39. We conduct a simple activation study using SPM2 and choose the particular voxel with the largest F‐statistic for the contrast involving the four auditory stimuli ([1 1 1 1]) within each seed region.
The results show a similar connectivity pattern from AI to several distinct brain regions across all four factor combinations (Fig. 2). This network includes a strong bilateral functional connection between the primary auditory cortex and the superior temporal gyrus (STG), including BA 42 and BA 22. This connectivity network can be thought of as a baseline language processing network involved in the cognitive processing of each of the four language processing stimuli in this study. The STG is ascendant to AI in this network. For different sentence stimuli, however, we additionally observe a strong connectivity between AI and BA 30 in the posterior cingulate (Fig. 2B), BA 18 in the occipital lobe, and left lateral BA 44 (Broca's Area) when compared to the connectivity of AI for same sentence stimuli (Fig. 2A). The AI is ascendant to these connections and thus exhibit elevated activity during a superset of the time for which BA 30 and BA 18 exhibit elevated activity. Thus, networks of connected brain regions to AI are significantly influenced by the sentence effect (different and same speaker), although not influenced at all by the speaker effect or the speaker‐sentence effect interaction. To illustrate the similar patterns of connectivity across the speaker factor, we include Figure 3A (same speaker) and 3B (different speaker).
Figure 2.
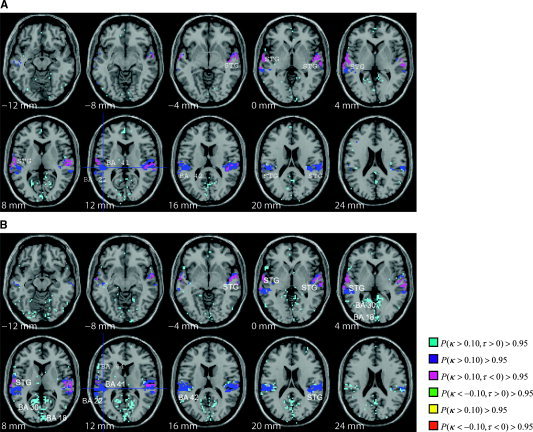
A: Thresholded posterior probability map of connectivity of the primary auditory cortex (BA 41, at crosshairs) for same sentence stimuli. Fifteen axial slices are shown from 12 mm below the anterior commissure (AC) to 44 mm above the AC. The crosshairs represent the seed region within BA 41. MTG and STG are ascendant to BA 41. B: Connectivity of BA 41 for different sentence stimuli (same and different speaker). MTG and STG are ascendant to BA 41, while BA 41 is ascendant to posterior cingulate (BA 30) and BA 18.
Figure 3.
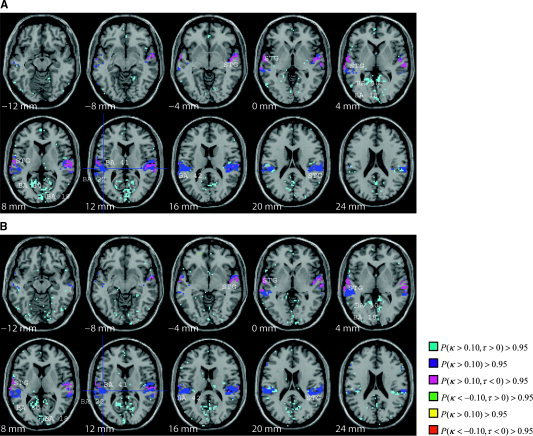
A: Thresholded posterior probability map of connectivity of the primary auditory cortex (BA 41, at crosshairs) for same speaker stimuli. Fifteen axial slices are shown from 12 mm below the anterior commissure (AC) to 44 mm above the AC. The crosshairs represent the seed region within BA 41. STG and MTG are ascendant to BA 41 and BA 41 is ascendant to posterior cingulate (BA 30) and BA 18. B: Connectivity of BA 41 for different speaker stimuli (same and different speaker). STG and MTG are ascendant to BA 41 and BA 41 is ascendant to posterior cingulate (BA 30) and BA 18.
The connectivity pattern from Wernicke's Area also exhibits similar features across each factor combination. There is a distinct connectivity between Wernicke's Area and the left lateral STG and BA 44 (i.e., Broca's Area) in each factor level that we can again consider as a baseline connectivity network. Wernicke's Area is ascendant to BA 44, while left lateral STG is ascendant to Wernicke's Area. However, there also exists a sentence effect, where a strong connectivity between Wernicke's Area and the posterior cingulate (BA 30) and BA 18 as well as connectivity to the MTG and bilateral STG is elicited in only different sentence stimuli (Fig. 4B) and not same sentence stimuli (Fig. 4A). For different sentence scans, Wernicke's Area is ascendant to the posterior cingulate and BA 18, while MTG and bilateral STG is ascendant to Wernicke's Area, suggesting that in the different sentence stimuli case, Wernicke's Area exhibits elevated activity a subset of the scans in which MTG and STG exhibit elevated activity and the posterior cingulate exhibits elevated activity a subset of the scans in which Wernicke's Area exhibits elevated activity. Similar to the networks including AI, networks of connected brain regions to Wernicke's Area are significantly influenced by the sentence effect, although not influenced at all by the speaker effect or the speaker‐sentence effect interaction.
Figure 4.
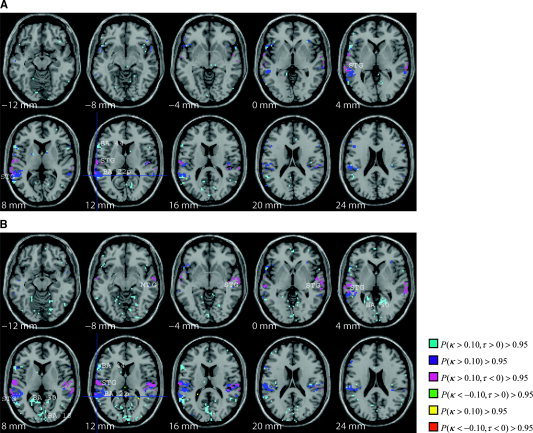
A: Thresholded posterior probability map of connectivity of Wernicke's Area (BA 22p, blue region at crosshairs) for same sentence scans (including same speaker and different speaker). Left STG is ascendant to Wernicke's Area while Wernicke's Area is ascendant to BA 44. B: Connectivity of Wernicke's Area for different sentence scans (including same speaker and different speaker). Bilateral STG and MTG are ascendant to Wernicke's Area while Wernicke's Area is ascendant to BA 44, posterior cingulate (BA 30) and BA 18.
Functional connectivity from BA 39, important in semantic processing [Binder et al., 1996], reveal no significant sentence or speaker effects. BA 39 shows strong functional connectivity (Fig. 5) to the precuneus (BA 31), medial frontal gyrus (BA 6), and BA 40. There also exists a distinct ascendancy to the anterior cingulate (BA 32).
Figure 5.
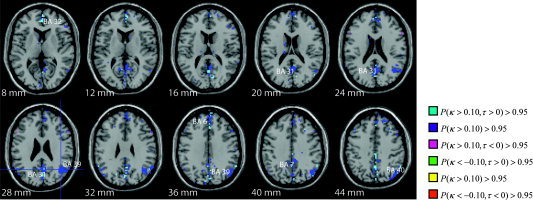
Thresholded posterior probability map of connectivity of BA 39 (at crosshairs). BA 39 shows strong functional connectivity to the precuneus (BA 31), medial frontal gyrus (BA 6). There also exists a distinct ascendancy to the anterior cingulate (BA 32).
Figure 6 summarizes the results as a diagram indicating connectivity from AI, Wernicke's Area, and BA 39. The additional connectivity for different sentence scans is visualized as red connections, whereas the baseline functional connections present across stimuli are visualized as black connections. Table 2 gives approximate Talairach coordinates of the seed regions and corresponding network regions for the networks summarized in Figure 6.
Figure 6.
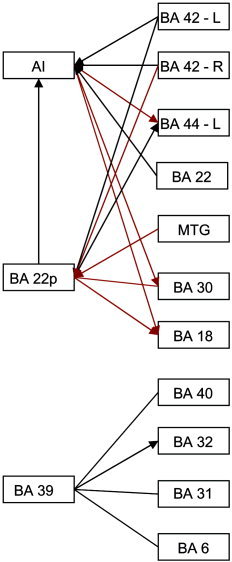
Summary of functional networks elicited by auditory stimuli. Connections shown in black are common to each of the 4 stimuli. Connections shown in red are present only in different sentence stimuli. Arrows, when present, indicate direction of ascendancy.
Table II.
Approximate Talairach coordinates of seed regions and regions in the corresponding functional networks referenced in the text
| Cortical area | Approximate Talairach coordinates |
|---|---|
| Seed regions | |
| AI | −49, −30, 12 |
| BA 22p | −58, −50, 12 |
| BA 39 | 48, −56, 12 |
| Network regions | |
| STG– BA 22 L | −64, −5, 4 |
| STG– BA 22 R | 47, −4, 1 |
| STG– BA 42 L | −58, −27, 16 |
| STG– BA 42‐R | 56, −28, 16 |
| BA 44‐L | −56, 15, 12 |
| MTG | 56, 2, −8 |
| BA 30 | −19, −57, 8 |
| BA 18 | −3, −91, 8 |
| BA 40 | 52, −58, 40 |
| BA 32 | −4, 42, 12 |
| BA 31 | −1, −68, 28 |
| BA 6 | −3, 42, 35 |
Network region Talairach coordinates estimated from thresholded cluster centroid.
DISCUSSION
This auditory processing fMRI study describes and uses a method developed by Patel et al. [ 2006] to determine hierarchical networks in the human brain critical to auditory language processing tasks. Furthermore, the study assesses the effects of listening to the same and different sentences and the same and different speakers on the connectivity of the brain.
We found a baseline hierarchical network consistent across all factor combinations involving the primary auditory cortex and BA 42 and BA 22 of STG, with BA 42 and BA 22 being ascendant to AI. These results suggest that the STG becomes active a superset of the time as AI, contrary to the model of language processing proposed by Binder and colleagues [Binder et al., 2000; Liebenthal et al., 2005]. According to their model, language processing shifts from merely processing the physical features of speech to phonological and then semantic processing as one moves from AI anteriorly along the STG. Thus, AI is functionally connected with regions involved in both phonetic and semantic processing. AI would be ascendant to STG in this model, whereas our results suggest that the STG activates a superset of the time for which AI activates. We found a significant sentence effect where for different sentence stimuli, AI is significantly ascendant to the posterior cingulate (BA 30), BA 18, and Broca's Area (BA 44). This result supports the result provided by Binder et al. [ 1997], which concludes that the posterior cingulate gyrus is actively involved in semantic processing. We conclude that the posterior cingulate activates a subset of the time of the STG and BA 41, as it is involved in mainly semantic processing, whereas STG and BA 41 are involved in both phonological and early auditory processing.
We found another baseline functional hierarchical network consistent across all four factor combinations involving Wernicke's Area, left STG, and BA 44 where Wernicke's Area is ascendant to BA 44 (Broca's Area) and the left STG is ascendant to Wernicke's Area. Broca's Area is known for its role in speech production. The connectivity between Wernicke's and Broca's Areas is consistent with the existence of strong anatomical connections between the two via the arcuate fasciculus, a major white matter fiber tract [Dronkers et al., 2000]. Although there is no significant speaker effect in these functional networks, there is a strong sentence effect on the connectivity between Wernicke's Area and posterior cingulate (BA 30), BA 18, and bilateral STG and MTG. In different sentence stimuli, Wernicke's Area is ascendant to posterior cingulate (BA 30) and BA 18, while bilateral STG and MTG are ascendant to Wernicke's Area. Wernicke's area is involved in semantic processing [Dronkers et al., 2000]. Consistent with the above findings for AI, this result can also be interpreted as showing that meaning (in Wernicke's area) is abstracted from sentences a subset of the time that the physical and phonological features of speech are processed in STG. The fact that connectivity was weaker for same sentence stimuli compared with different sentence stimuli suggests that there is less abstraction of meaning in the same sentence condition compared with the different sentence condition, as one would expect.
Finally, the functional network including BA 39, an area important in semantic processing, was consistent across each factor combination, with no sentence or speaker effect influencing this network. BA 39 shows strong functional connectivity (Fig. 5) to the precuneus (BA 31), medial frontal gyrus (BA 6), and BA 40. There also exists a distinct ascendancy to the anterior cingulate (BA 32). This connectivity network supports the findings by Binder et al. [ 1997] that the anterior cingulate, posterior cingulate, and BA 39 all play an important role in semantic processing.
There are some shortcomings inherent to this approach. First, this approach is unable to elicit functional networks without at least prespecifying a seed region from which to begin. Fortunately, we are able to specify a multitude of seeds from which we can examine functional networks, but these, nonetheless, must be specified. Second, we must be careful to extrapolate the interpretation of ascendancy and hierarchical networks as a measure of influence. Although it may be possible for a brain region which is ascendant to another to influence that brain region, this measure of ascendancy does not directly measure influence, nor should it be interpreted as such. Furthermore, our approach currently only assesses relationships from the seed at one level. We do not recursively explore connectivity maps by seeding regions found to be significantly connected to the seed, thus limiting our functional networks to brain regions connected only to any of the three seed regions we used in this study.
A second approach which can be used to explain neurophysiological response in one cortical area in terms of the response in another area and an experiment stimulus is by examining psychophysiological interactions (PPIs) [Friston et al., 1997]. PPIs examine the contribution of one cortical area to another in terms of the degree to which the neurophysiological response in the second area can be predicted from the response in the first. The PPI itself is the effect of the contribution of the experimental stimulus. Our hierarchical functional network approach determines connectivity and its modulation across experimental stimuli in a novel manner, which allows for a different interpretation of connectivity. Ascendancy from one brain region to another implies that the ascendant region may be more involved in the experimental task than the other, while both are involved in some way. This allows the organization of a network with central and satellite brain regions based on ascendancy, and subsequently cortical regional involvement in particular experimental tasks.
The study of functional neural networks in the human brain is important to understand language processing. Studying the relationship among several brain regions under certain auditory stimuli may help extend the current model of language processing and further our understanding of language processing in the human brain.
Acknowledgements
We thank the Organization for Human Brain Mapping, the MIDAC group, and Jean‐Baptiste Poline for organizing the Functional Imaging Analysis Contest and asking us to contribute to this special issue of Human Brain Mapping.
REFERENCES
- Ashburner J, Friston KJ (1999): Nonlinear spatial normalization using basis functions. Hum Brain Mapp 7: 254–266. [DOI] [PMC free article] [PubMed] [Google Scholar]
- Binder JR, Frost JA, Hammeke TA, Rao SM, Cox RW (1996): Function of the left planum temporale in auditory and linguistic processing. Brain 119: 1239–1247. [DOI] [PubMed] [Google Scholar]
- Binder JR, Frost JA, Hammeke TA, Cox RW, Rao SM, Prieto T (1997): Human brain language areas identified by functional magnetic resonance imaging. J Neurosci 17: 353–362. [DOI] [PMC free article] [PubMed] [Google Scholar]
- Binder JR, Frost JA, Hammeke TA, Bellgowan PSF, Springer JA, Kaufman JN, Possing ET (2000): Human temporal lobe activation by speech and nonspeech sounds. Cereb Cortex 10: 512–528. [DOI] [PubMed] [Google Scholar]
- Broca P (1861): Remarques sur le sie'ge de la faculte' du langage articule; suivies d'une observation d'aphemie. Bull Soc Anat Paris 6: 330–357. [Google Scholar]
- Dehaene‐Lambertz G, Dehaene S, Anton JL, Campagne A, Ciuciu P, Dehaene GP, Denghien I, Jobert A, LeBihan D, Sigman M, Pallier C, Poline JB (2006): Functional segregation of cortical language areas by sentence repetition. Hum Brain Mapp 27: xx–xx. [DOI] [PMC free article] [PubMed] [Google Scholar]
- Dronkers NF, Pinker S, Damasio A (2000): Language and the aphasias In: Kandel ER, Schwartz J, Jessell T, editors. Principles of neural science, 4th ed. New York: McGraw‐Hill; p 1169–1187. [Google Scholar]
- Friston KJ, Frith CD, Liddle PF, Frackowiak RS (1993): Functional connectivity: the principal component analysis of large (PET) data sets. J Cereb Blood Flow Metab 13: 5–14. [DOI] [PubMed] [Google Scholar]
- Friston KJ, Buechel C, Fink GR, Morris J, Rolls E, Dolan RJ (1997): Psychophysiological and modulatory interactions in neuroimaging. Neuroimage 6: 218–229. [DOI] [PubMed] [Google Scholar]
- Liebenthal E, Binder JR, Spitzer SM, Possing ET, Medler DA (2005): Neural substrates of phonemic perception. Cereb Cortex 15: 1621–1631. [DOI] [PubMed] [Google Scholar]
- Marchini JL, Smith SM (2003): On bias in the estimation of autocorrelations for fMRI voxel time‐series analysis. Neuroimage 18: 83–90. [DOI] [PubMed] [Google Scholar]
- Ogawa S, Lee TM, Nayak AS, Glynn P (1990): Oxygenation‐sensitive contrast in magnetic resonance image of rodent brain at high magnetic fields. Magn Reson Med 14: 68–78. [DOI] [PubMed] [Google Scholar]
- Patel RS, Bowman FD, Rilling JK (2006): A Bayesian approach to determining connectivity of the human brain. Hum Brain Mapp 27: 267–276. [DOI] [PMC free article] [PubMed] [Google Scholar]
- Wernicke C (1874): Der aphasische Symptomenkomplex. Breslau: Cohn, Weigert. [Google Scholar]
- Wise R, Chollet F, Hadar U, Friston K, Hoffner E, Frackowiak R (1991): Distribution of cortical neural networks involved in word comprehension and word retrieval. Brain 114: 1803–1817. [DOI] [PubMed] [Google Scholar]


