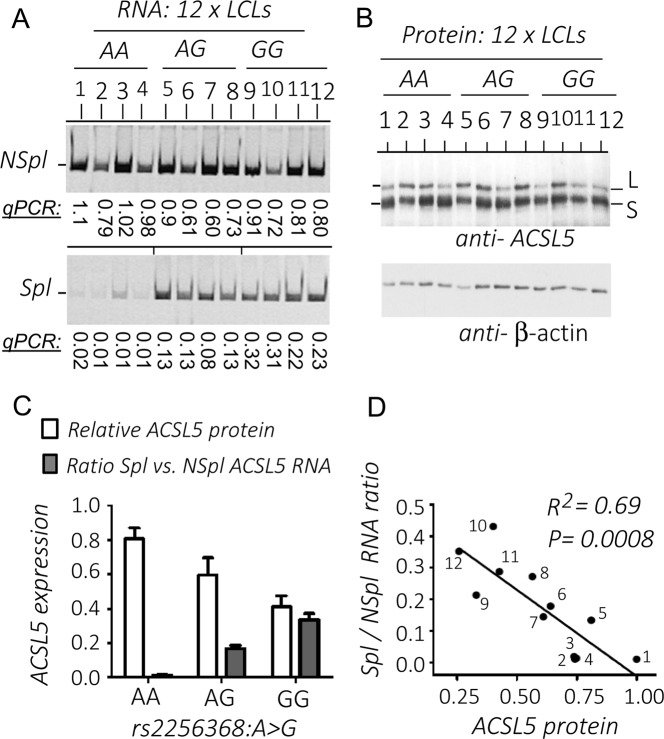
Fig. 2.
Analysis of ACSL5 expression in LCLs. a Quantification of RNA isoforms in 12 LCLs. This panel has been previously published by Matesanz et al. [23], licensed under a Creative Commons Attribution-NonCommercial-ShareAlike 4.0 International License, http://creativecommons.org/licenses/by-nc-sa/4.0/. The panels show end-point PCR amplification visualized in polyacrylamide gel electrophoresis and, additionally, quantified by relative real-time qPCR:(top) Nonspliced ACSL5 transcripts (NSpl); (bottom) spliced ACSL5 transcripts (Spl). b Western blots with an anti-ACSL5 antibody of the same LCLs as in the RNA panel. An anti-beta-actin HRP-labeled antibody was used as a loading control for relative protein quantification (“Materials and methods” and Supplementary Material S1). c Plot representing relative expression levels of ACSL5 protein (L+S) (white bars) and ratio of Spl versus NSpl RNAs (dark bars). d Correlation plot of Spl to NSpl RNA ratios versus relative ACSL5 protein levels. Pearson correlation was used to estimate determination coefficient (R2) and P-value

