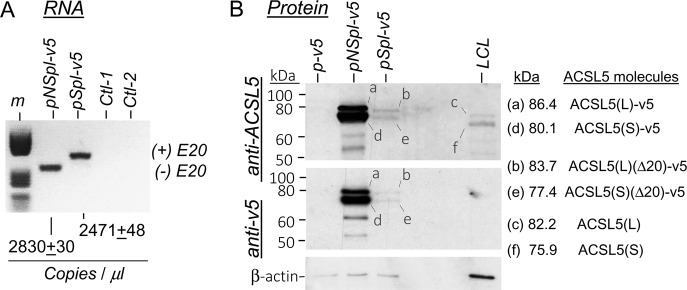
Fig. 3.
Expression analysis of Spl and NSpl constructs in transfected HEK293 cells. a Droplet digital PCR quantification of RNA expression from the spliced (pSpl) and nonspliced (pNSpl) cDNAs, visualized in agarose-gel electrophoresis. Ctl-1 and Ctl-2 were PCR negative controls (RT performed without RT enzyme) for each isoform. Lane m was loaded with a DNA size marker mix (Marker V from Roche). b ACSL5 protein expression analysed by western blots of extracts from the transfected cells. Lane LCL is a positive control extract containing endogenous ACSL5 from one LCL, for comparison with the recombinant constructs from transfected cells. Lane kDa represents the position of molecular size markers. Letters and lines inside the blots are explained on the right site, representing the protein sequence-calculated molecular weights of the different ACSL5 molecules detected

