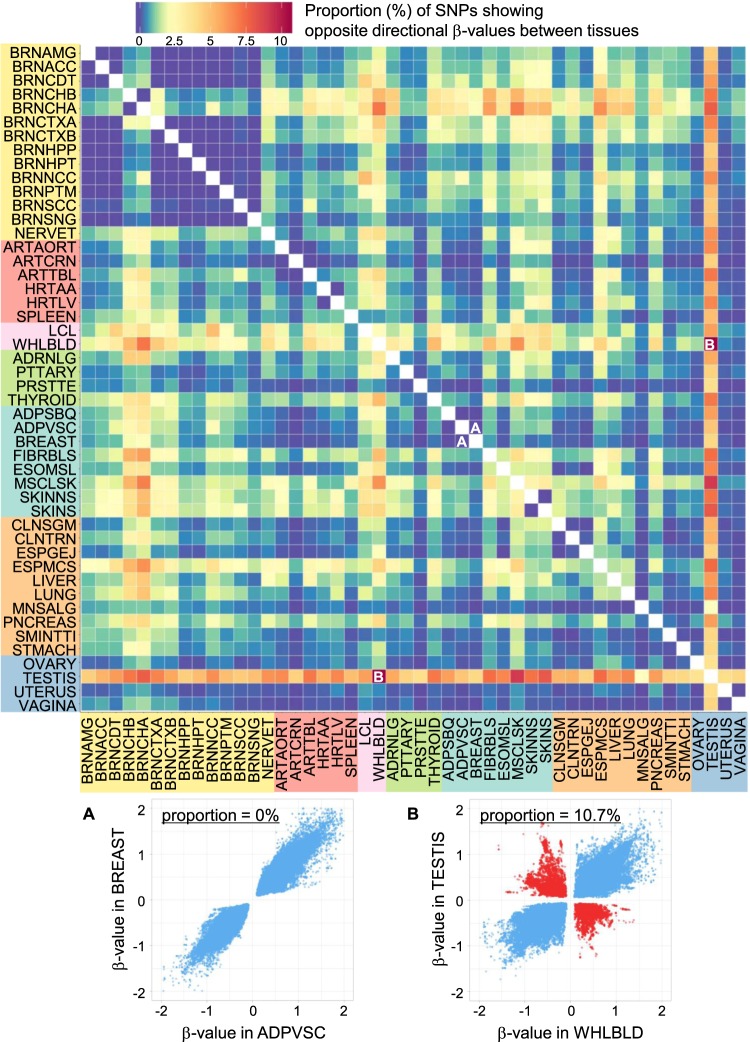
Fig. 3.
Heatmap of the proportion of SNPs showing opposite directional β-values. For each tissue pair, SNPs showing significant eQTL signals in both tissues were extracted. Direction of the β-values (effect sizes) of the SNPs was compared in each tissue pair, and proportion (%) of the SNPs that showed opposite directional β-values is shown by heatmap with the color scale shown on the top (blue to red). Plots of β-values of the SNPs in the two representative tissue pairs are shown on the bottom: A visceral adipose (ADPVSC) vs. breast (BREAST) and B whole blood (WHLBLD) vs. testis (TESTIS). SNPs with the same directional β-values are indicated as blue points, and SNPs with the opposite directional β-values are indicated as red points. There were no opposite eQTL effects found between ADPVSC and BREAST, while the largest proportion (10.7%) of the opposite eQTL effects were detected between WHLBLD and TESTIS

