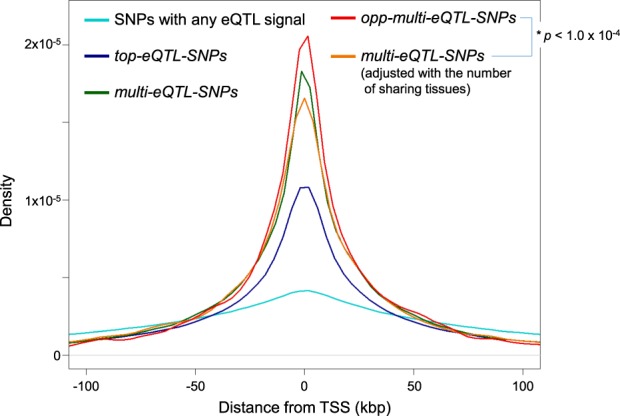
Fig. 4.

Distribution of the distance from TSS in each type of SNPs. For each type of SNPs (SNPs with any eQTL signal, top-eQTL-, multi-eQTL-, and opp-multi-eQTL-SNPs), the distribution of the distance from TSS is shown (in light blue, dark blue, green, and red, respectively). To adjust the number of sharing tissues of multi-eQTL-SNPs to that of opp-multi-eQTL-SNPs, subset of the multi-eQTL-SNPs was also analyzed, which is shown in an orange line. The TSS enrichment was evaluated on kurtosis of the density plot, and its significance level in opp-multi-eQTL-SNPs compared to adjusted multi-eQTL-SNPs was p < 1.0 × 10⁻⁴, which was determined by 10,000-time random sampling
