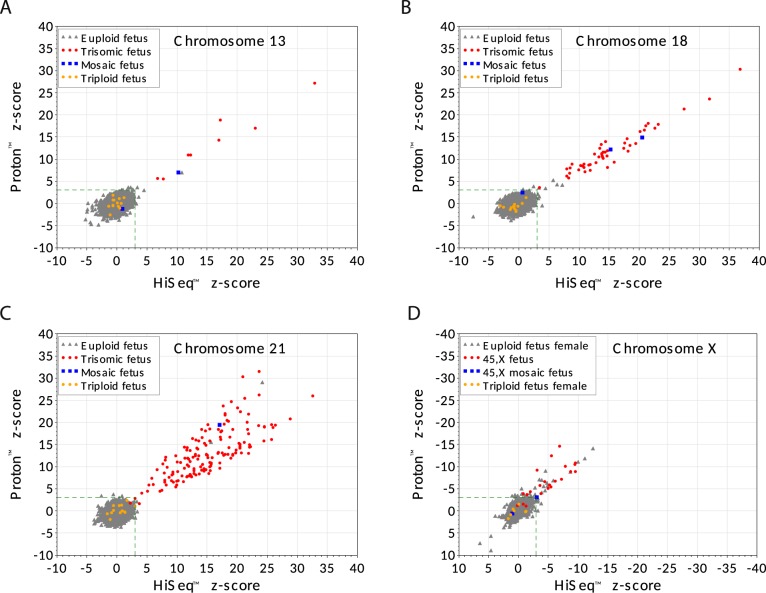
Fig. 2.
Individual z-scores and reference standard result for all fetuses tested with both index tests. Scatter plot of z-scores for same 3593 plasma samples comparing each index test (Proton (Y-axis) vs HiSeq (X-axis)) for chromosome 13, chromosome 18, chromosome 21, and chromosome X. Green triangles represent fetuses which, according to the reference standard, do not have the specific aneuploidy identified in the plot, while red circles represent fetuses that have the specific chromosome aneuploidy. Blue squares correspond to mosaic fetuses for the specific chromosome of interest, while yellow circles are triploid fetuses according to the reference standard. The lower left dashed green box in each plot shows the decision limit: z-score = 3

