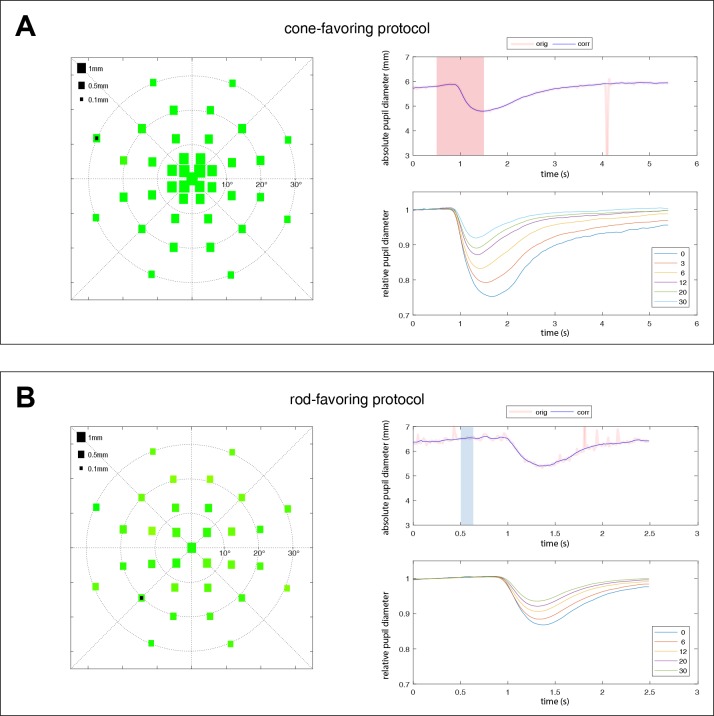
Figure 3.
Averaged pupillary responses over all subjects (n = 14) for the cone (A) and rod (B) protocols. The left column shows the averaged absolute values of the maximal constriction amplitudes. The size of the squares represents the amount of pupil constriction (in mm) after the respective local light stimulation. The right column shows the raw data of one exemplary pupillographic trace (upper right column). Stimulus presence is indicated as shaded red (cone) or blue (rod) areas. The location of that exemplary trace is marked by a black square on the scatter plot on the left side. The averaged relative pupillary traces corrected for baselines and sorted by their eccentricity from the center with 0° to 30° are presented in the lower right column.

