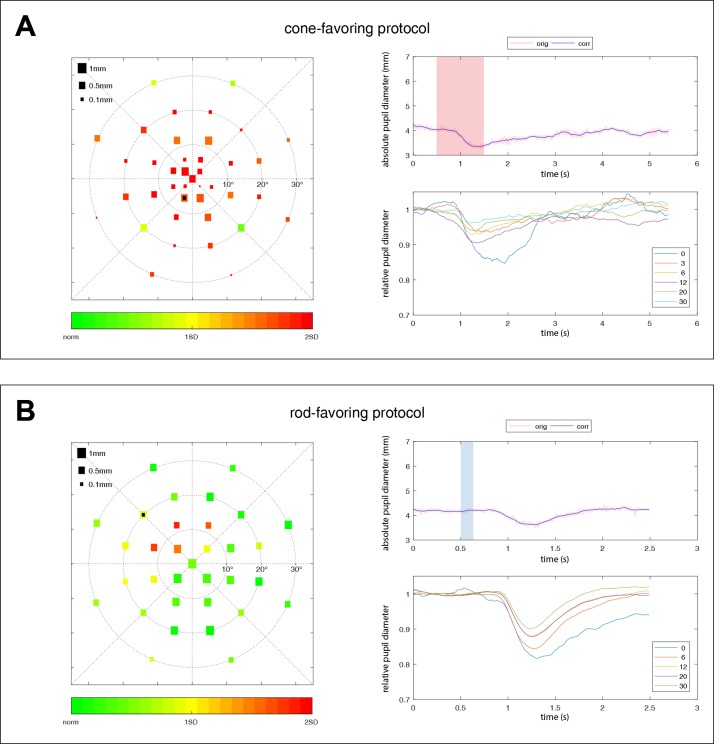
Figure 7.
Exemplary pupillary responses for a patient suffering from achromatopsia with confirmed CNGA3-mutations showing severely impaired responses to the cone protocol following “rod-typical” time-dynamics (A) and preserved responses to the rod protocol (B). The size of the squares in the scatter plot on the left represents the amplitude of pupil constriction after the respective local light stimulation. Color scale indicates deviation from the mean of the healthy group from green to red. The right column shows the raw data of one exemplary pupillographic trace (upper right column). Stimulus presence is indicated as shaded red (cone) or blue (rod) areas. The location of that exemplary trace is marked by a black square on the scatter plot on the left side. The averaged relative pupillary traces corrected for baselines and sorted by their eccentricity from the center with 0° to 30° are presented in the lower right column.

