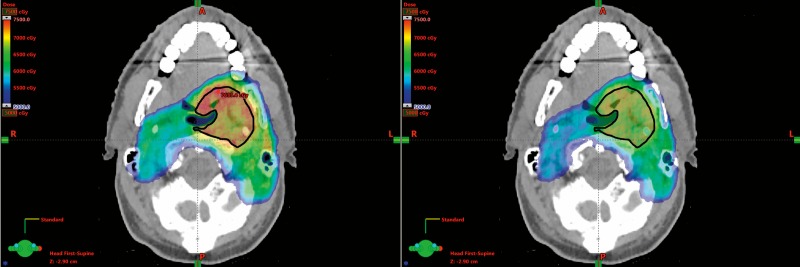
Figure 3.
Comparison of the biological plan (left) and physical plan (right) for a patient who developed a grade 3 painful ulcer in the left posterior tongue adjacent to the mandibular last molar. Dose is shown in colorwash (limits 50 to 75 Gy relative biological effectiveness [RBE]). Clinical target volume (CTV)-66 Gy is outlined by the black line. The hot spot (∼76 Gy [RBE eq]) is indicated by a red dot in the biological model and is 2 mm from the anterior border of the CTV-66 Gy. The dose in this area according to the physical model is 69 Gy (RBE = 1.1).

