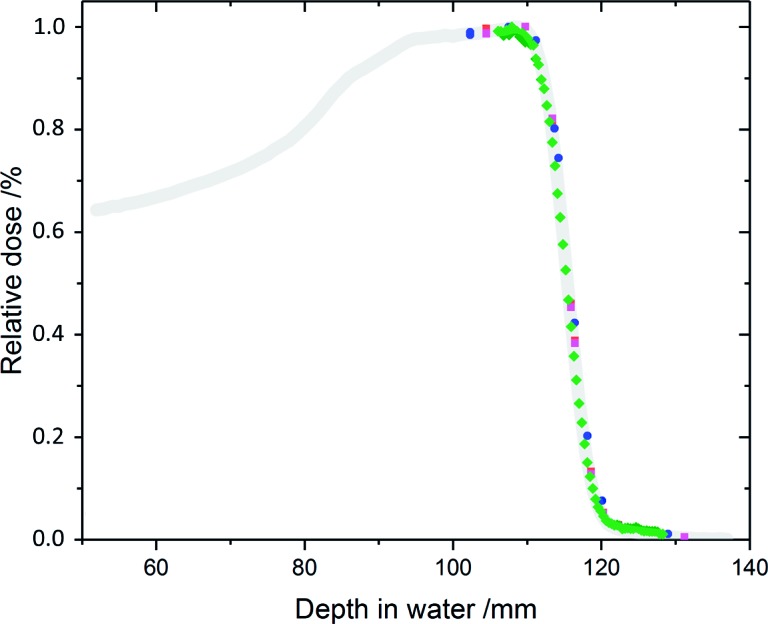
Figure 4.

Relative depth-dose distributions measured in the cell phantom applying the semiflex IC (blue) on beam axis, the Markus ionization chamber in flasks right (black) and left (red) from beam axis and a stack of 62 EBT3 films (green) at left flask position. For comparison, the relative depth-dose distribution measured with the Blue Phantom (grey, [20]) is shown.
