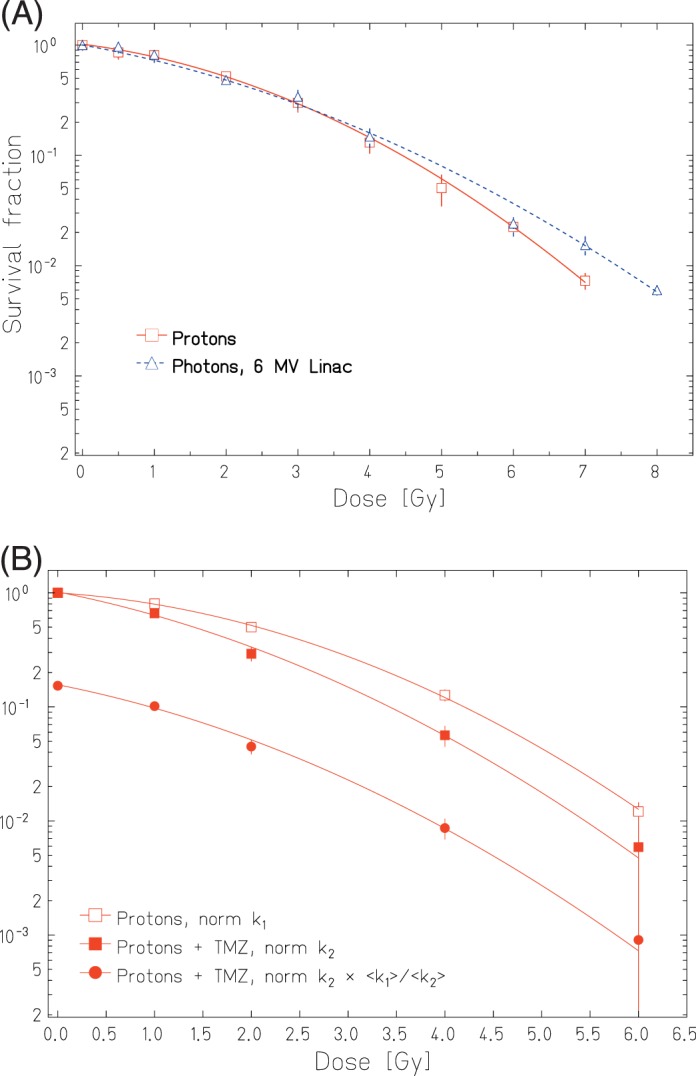
Figure 5.

(A) Experiment 1: Cellular survival curves measured for LN229 cells treated with 150 MeV protons in mid–spread-out Bragg peak and with 6 MV Linac photons. (B) Experiment 2: Dose-dependent clonogenic survival obtained after treatment with 150 MeV mid–spread-out Bragg peak protons alone (open squares) and in combination with (B) Experiment 2: Dose-dependent clonogenic survival obtained after treatment with 150 MeV mid-SOBP protons alone (open squares) and in combination with TMZ (filled symbols). The dose response curves for combined treatment are shown twice: normalized to the unirradiated control k2 (filled squares) and additionally multiplied by the ratio of the averaged k1 and k2 (filled dots). The plotted survival fraction values are shown with their corresponding standard error of the mean.
