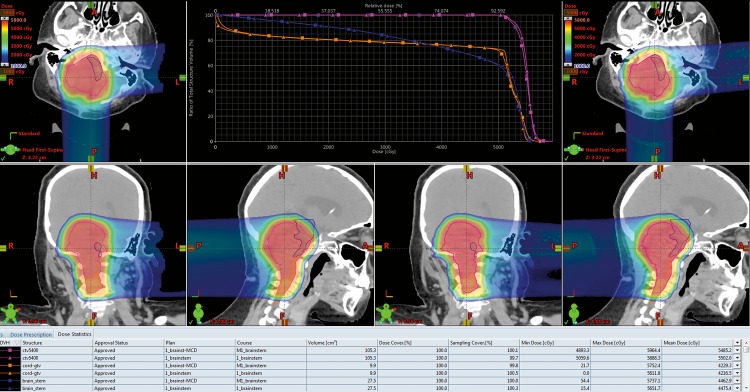
Figure 1.
The dose colorwash and dose-volume histogram (DVH) plots for the treatment planning system (TPS) and Monte Carlo (MC) dose calculation are displayed. The images on the left are from the TPS calculation, and on the right is the MC. The magenta DVH is the target; the other 2 are serial-type critical structures. The triangle markers are for the TPS DVH; the square is for the MC. For this patient, there were no meaningful differences in the 2 calculations, so no intervention was required.

