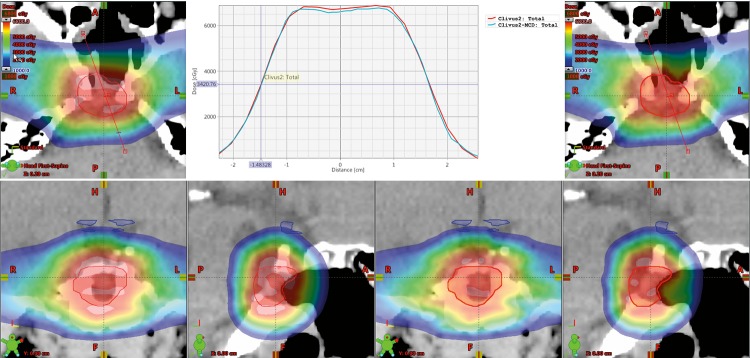
Figure 2.
The dose colorwash of the treatment planning system (TPS) generated distribution (left) and the Monte Carlo generated dose distribution (right) for a central brain tumor with a clinical target volume (CTV) (red) that is approximately 2 cm in diameter. The graph in the center displays the dose profile through the center of the CTV, with red representing the TPS calculation. Note that the Monte Carlo dose distribution is 2.2% lower than that from the TPS in the center region of the CTV. This difference is attributed to the small target size and the complex heterogeneous surroundings. This plan would be suitable for renormalization.

