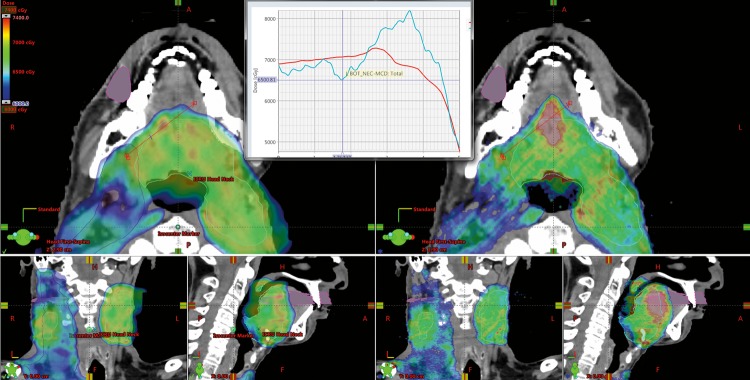
Figure 3.
The dose colorwash of the treatment planning system generated distribution (left) and the Monte Carlo generated dose distribution (right) for a head and neck treatment. There exists a notable region where the Monte Carlo calculation results in an approximately 15% increased dose. Upon investigation it was determined that the beam was traveling parallel to a large bone/air interface near the trachea and vertebral bodies, resulting in the discrepancy, which is not located immediately adjacent to those interfaces.

