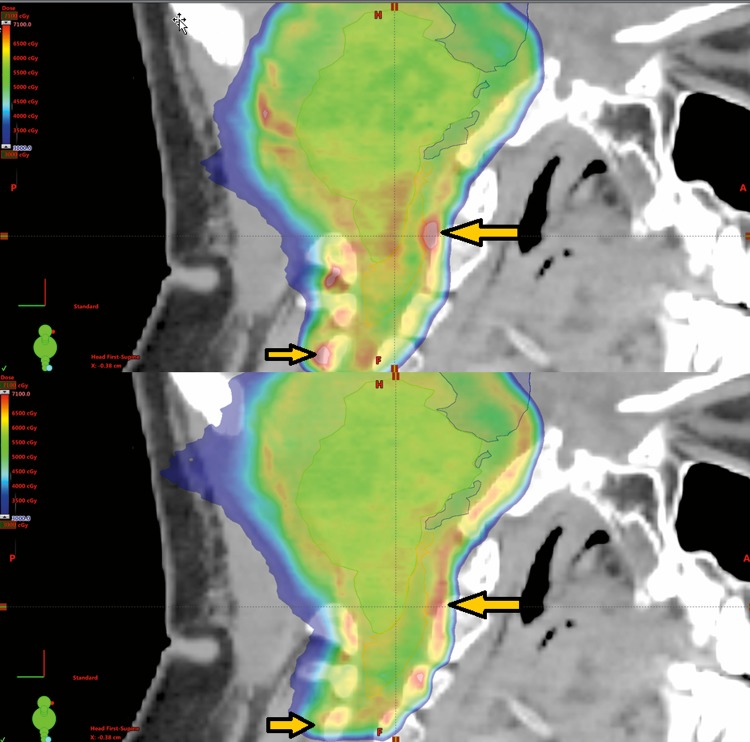
Figure 4.
The dose colorwash for the dose-weighted linear energy transfer weighted biological dose calculation for the initial plan (top) and after modification (bottom). The modification was done to reduce the high biological dose indicated by the yellow arrows. In the region of the biological hot spots, the physical dose of the initial plan is 2% higher than the modified plan, but the biological dose is ∼10% different. Small modifications of margin and gantry angle resulted in an improved biologic dose profile in critical locations such as the brainstem and spinal cord.

