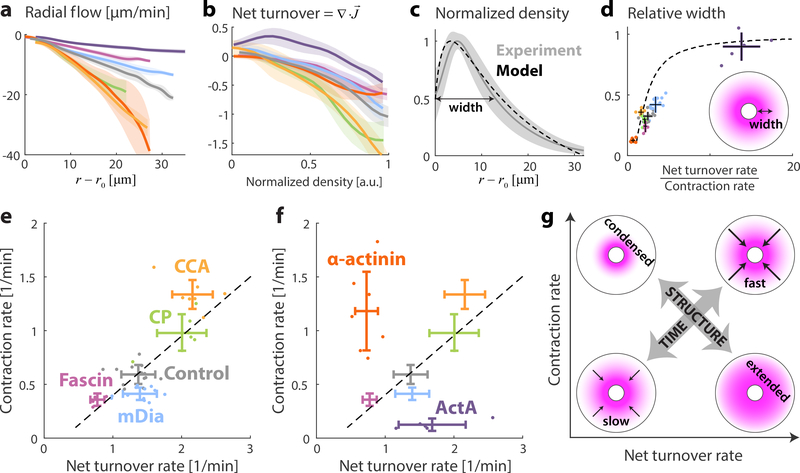
Figure 4. Characteristics of contractile actin networks with turnover.
The contracting flows and actin turnover were measured for contractile actin networks formed under different conditions, including 80% extract (control; grey) and samples supplemented with 1.5μM ActA (purple); 2.6μM Fascin (magenta); 0.5μM mDia1 (cyan); 10μM α-Actinin (red); 0.5μM Capping Protein (green); or 12.5μM Cofilin, 1.3μM Coronin and 1.3 μM Aip1 (orange). (a) The radial network flow rate is plotted as a function of distance from the contraction center. For each condition, the mean (line) and std (shaded region) over different droplets are depicted. (b) The net actin turnover as a function of network density is plotted for different conditions. The contraction rate and turnover rate are determined for each droplet from the slopes of linear fits to the radial network flow as a function of distance, and the net turnover as a function of density, respectively (see Methods, Fig. S2). (c) The measured network density profile for the control sample is compared to the predictions of a model which assumes constant turnover and contraction rates (Supp. Information). The measured density distribution (mean and std) nicely matches the model predicted distribution based on the average values of the turnover and contraction rates, β= 1.4 min−1 and k=0.65 min−1 (dashed line). (d) The relative width of the network profile (quantified as the distance between the inner boundary and the position where the network reaches half its maximal value, normalized by the droplet’s radius) is plotted as a function of the ratio between the net turnover rate and the contraction rate. The dots depict values for individual droplets and the error bars show the mean and std for all the droplets examined for each condition. The model results (dashed line; Supp. Information) predict the increase of the network width as a function of the ratio between the net turnover rate and the contraction rate. (e,f) Scatter plots of the contraction rate and net turnover rate for different conditions. For each condition, the dots depict values for individual droplets and the error bars show the mean and std for all the droplets examined for each condition. (e) The contraction rate is correlated with the turnover rate for the conditions examined (Pearson correlation=0.76, p<10−8). The dashed line depicts a linear fit. (f) The correlation between the contraction rate and the turnover rate breaks down for samples with added ActA or α-Actinin. (g) Schematic illustration of the behavior of networks with constant contraction and turnover rates. Increasing the contraction and turnover rates proportionally leads to faster network dynamics but the network density profile remains the same, whereas changes in the ratio between the contraction and turnover rates leads to significant modifications in network structure (Supp. Information).

