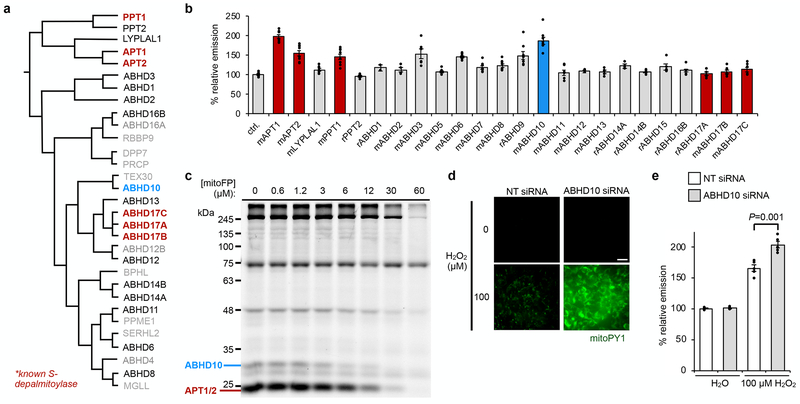
Fig. 3. ABHD10 regulates mitochondrial redox buffering capacity.
(a) Dendrogram adapted from literature14 depicting known depalmitoylases (bold) and members of the mSH family screened for potential peptide S-deacylase activity in HEK293T cells. Additionally, ABHD5, ABHD7, ABHD9 and ABHD15 were included in the screen. (b) Epifluorescence-based screening with S-deacylase probe DPP-2 in cells overexpressing a library of proteins related to the known APTs. ‘m’ and ‘r’ indicate mouse and rat, respectively. Data expressed as mean ± s.e.m. (n ≥ 2 images from two biological replicates) and normalized to control cells treated with empty vector. ABHD10 (blue), a putative mitochondrial protein35, enhances DPP-2 signal to a similar extent as APT1 (red). (c) Competitive activity-based protein profiling (ABPP) of serine hydrolases in HEK293T cells treated with indicated concentrations of mitoFP shows a dose-dependent inhibition of ABHD10 activity. After treatment with the inhibitor, the cell lysates were reacted with FP-TAMRA and the analyzed by in-gel fluorescence. Decreased fluorescence signal indicates proteins inhibited by mitoFP. Full gel images are shown in Supplementary Figures 15 and 46. (d) Representative images showing that ABHD10 knockdown diminishes the mitochondrial redox buffering capacity in HEK293T cells exposed to H2O2 as measured by epifluorescence microscopy using mitoPY1. 25 μm scale bar shown. (e) Quantification of the relative fluorescence intensity from mitoPY1 in each set of conditions shown in d. Statistical analyses performed with a two-tailed Student’s t-test with unequal variance (n = 5 images). Data expressed as mean ± s.e.m. and normalized to control cells treated with NT siRNA. Three biological replicates were performed.

