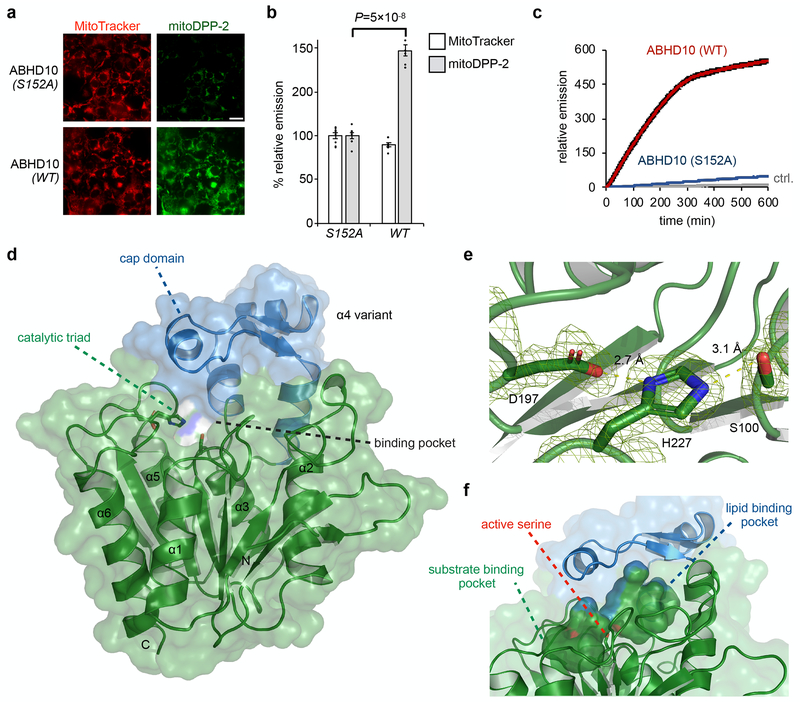
Fig. 4. Biochemical and structural characterization of ABHD10.
(a) Representative images confirming mitochondrial S-deacylation activity of ABHD10 (WT vs S152A) in HEK293T cells as measured using mitoDPP-2, a mitochondrial APT probe. 25 μm scale bar shown. (b) Quantification of relative fluorescence intensities from mitochondrial marker MitoTracker (black) and mitoDPP-2 (grey) in each set of conditions shown in a. Statistical analyses performed with a two-tailed Student’s t-test with unequal variance (n = 8 images from two biological replicates), Data expressed as mean ± s.e.m. and normalized to cells expressing ABHD10 (S152A). Dots represent individual data points. (c) In vitro kinetic assay showing S-depalmitoylation activity of recombinant mature ABHD10 (500 nM, red) and S152A variant (500 nM, blue) compared to control without added enzyme (grey) as measured using the peptide S-depalmitoylase probe DPP-5 (5 μM). Data expressed as mean ± s.e.m (n = 4 biological replicates) and normalized to relative emission of control (grey) at t = 0. (d) X-ray diffraction structure of mature ABHD10 from Mus musculus (PDB: 6NY9). The “cap” domain (blue) sits above the catalytic triad (shown as sticks) and forms pockets. (e) Zoomed-in view of the Asp–His–Ser catalytic triad shown with weighted 2Fo–Fc electron density map (carve = 1.5). Length of hydrogen bonds between Asp and His (2.7 Å) and His and Ser (3.1 Å) is shown. (f) The surface of two major cavities within mouse ABHD10 crystal structure is shown, along with the hydroxyl group of the active serine (shown in sticks), which points towards the junction of the two cavities.

