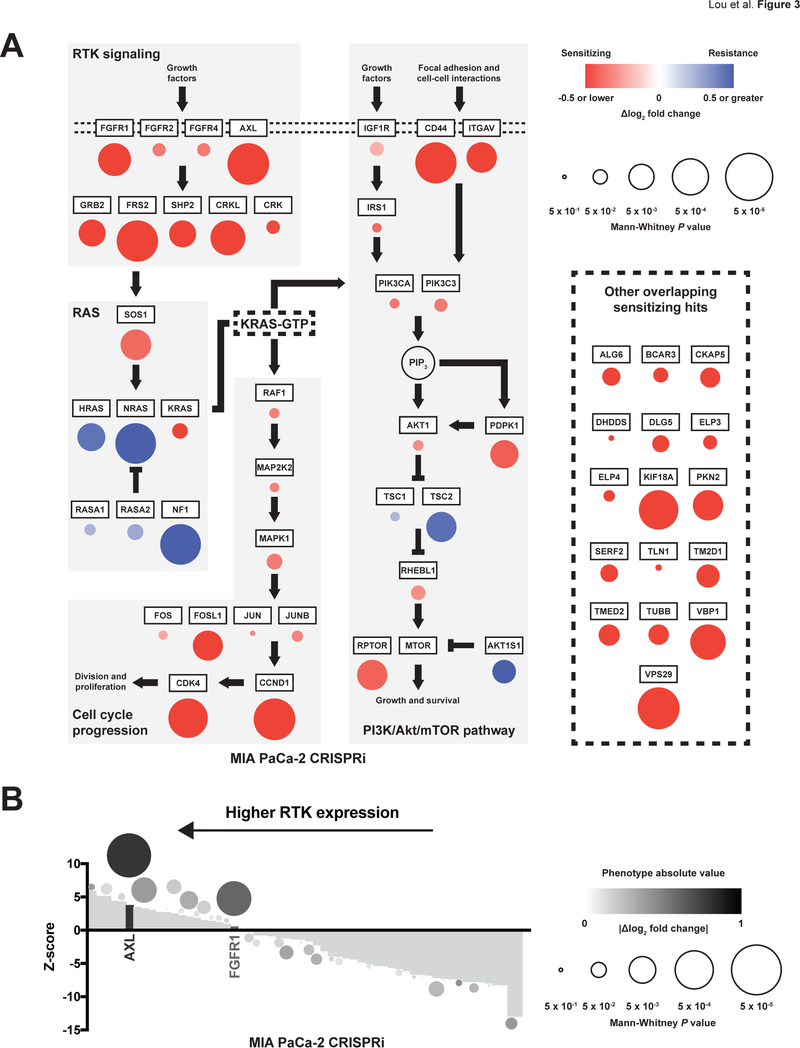
Fig. 3. Critical signaling modules cooperatively sustain a KRASG12C-driven pro-growth and pro-survival program around KRAS-GTP.
(A) Pathway map of CRISPRi screen gene phenotypes and Mann-Whitney P values from MIA PaCa-2 ARS-1620 sensitization (red) and resistance (blue). Color intensities portray phenotype strength, and circle diameters represent −log10 Mann-Whitney P values derived from the CRISPRi screen. (B) Waterfall plot of expression data from the Cancer Cell Line Encyclopedia (CCLE) and phenotype magnitudes of 58 human RTKs from the CRISPRi screen in MIA PaCa-2 cells. Z score on the x axis represents normalized mRNA expression data from RNA-seq, whereas color intensity and circle size represent phenotypes and Mann-Whitney P values from the CRISPRi screen, respectively. Cells in (A) and (B) were grown in 2D adherent culture. Phenotypes in (A) and (B) represent two biological replicates.

