
Fig. 6.
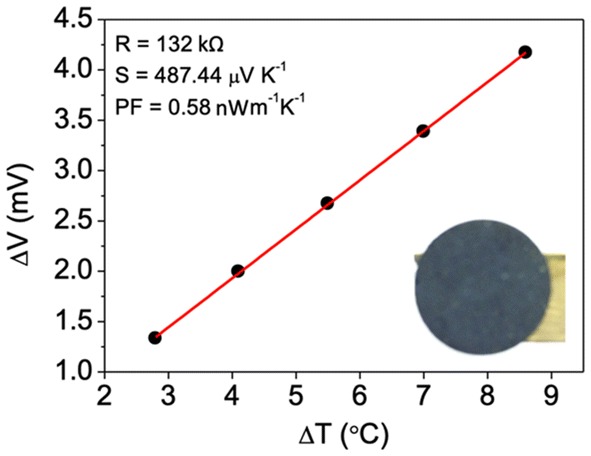
Thermo-voltage vs. temperature difference plot measured from an Mg2Si pellet. From the linear fit slope, the Seebeck coefficient was determined and enabled the calculus of the power factor, being both values indicated
Official websites use .gov
A
.gov website belongs to an official
government organization in the United States.
Secure .gov websites use HTTPS
A lock (
) or https:// means you've safely
connected to the .gov website. Share sensitive
information only on official, secure websites.
Thermo-voltage vs. temperature difference plot measured from an Mg2Si pellet. From the linear fit slope, the Seebeck coefficient was determined and enabled the calculus of the power factor, being both values indicated