
Fig. 8.
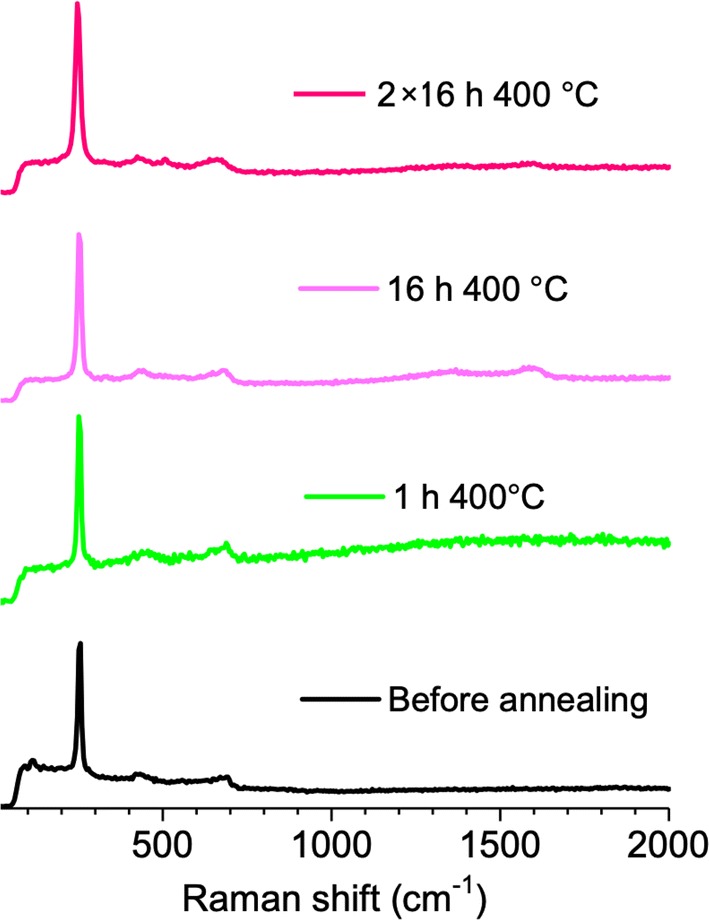
Raman spectra measured from replicas Mg2Si pieces made of 92% of Mg2Si and 8% of solution of PVDF in DMF before and after sintering performed at 400 °C of different durations: 1 h, 16 h and 32 h. Black and green curves correspond to one sample before and after sintering and pink curves correspond to another sample, first sintered by 16 h and next to another 16 h sintering (the 32 h were not followed)