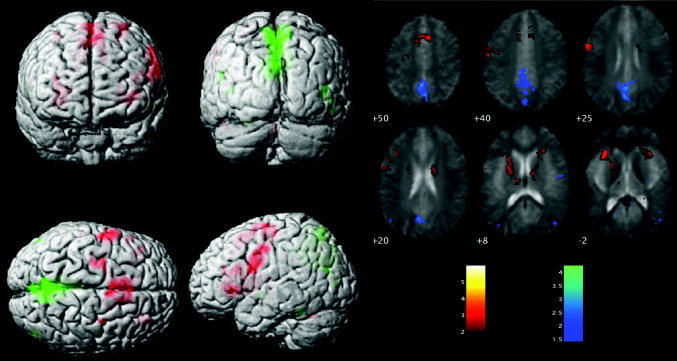
Figure 1.

Brain activity during the OLR task. Main effect of OLR task above (activation) and below (deactivation) the baseline fixation condition. A: Results projected onto the surface of a single rendered brain (activation, red; deactivation, green). B: Results are overlaid onto the average EPI of the six subjects, with activation (task > rest) shown in “hot” colours and deactivation in “cold” colours.
