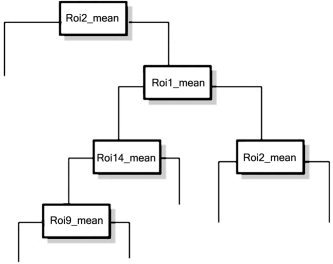
Figure 2.

Classification and regression trees (CART) plot, showing the first six nodes (up to three‐way interactions) for the peak and mean MRI signal (max and min). All 19 brain regions were included in the full tree applied to the single trials data.
