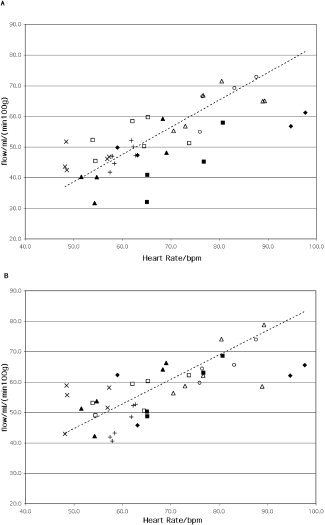
Figure 2.

Individual rCBF in the right (A) and left (B) central insular cortex plotted against heart rate. rCBF was calculated as the average of all activated pixels in the respective region in the spatially normalized PET images before smoothing. Data are from healthy subjects at rest and during rhythmic handgrip. Heart rate is averaged over the scan interval. The correlation coefficients are 0.72 and 0.71 for right and left insular cortex, respectively (P < 0.05). Each subject is plotted with an individual marker symbol. The linear fit is plotted as a dashed line.
