
Figure 3.
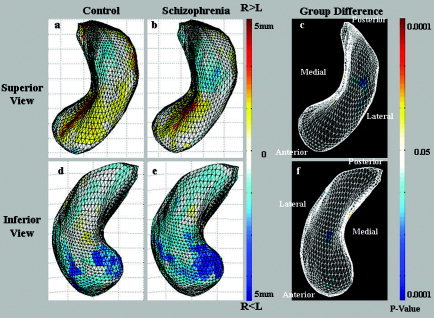
The mean square difference (MSD) results are illustrated in the control (a, d) and the schizophrenia (b, e) groups. The group differences of shape asymmetry are presented in c and f. In both cases, the shape asymmetry is mapping onto the right hemisphere (RH) average hippocampal model. The regions in which the RH hippocampus is larger than is the left hemisphere (LH) hippocampus are noted in red. In particular, the RH hippocampus was bilaterally larger than the LH hippocampus was in the head of the superior CA1 (a, b); however, we showed that the superior aspect of the LH hippocampi was large in both control and schizophrenia groups (d, e), but was not statistically significant (c, f).