
Figure 5.
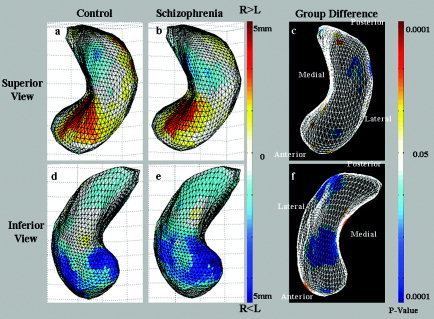
Shape asymmetry of the hippocampus for control (a, d) and schizophrenia groups (b, e) through principal component analysis. The subtle regions of L > R and R > L are prominent. As shown in c and f, the shape asymmetry of the schizophrenia group was smaller in the head and middle of the superior subiculum, CA3/CA4, and in the tail of the inferior CA1.