
Figure 2.
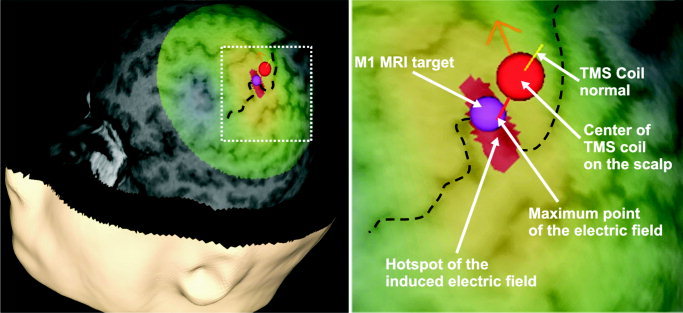
Cortical stimulation site in the M1 area of subject 1. Dashed black line = central sulcus; red‐yellow‐green area on the cortex = induced electric field (red area = stimulation hotspot); orange arrow = direction of the current; purple sphere = M1 target location.