
Figure 3.
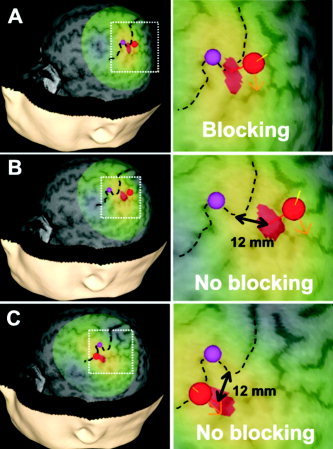
Cortical stimulation sites in S1 area of one subject. A: S1 thenar cortical location in subject 1. Dashed black line = central sulcus; red sphere = center of the TMS coil on the scalp; red‐yellow‐green area on the cortex = TMS‐induced electric field (red area = maximum of the induced electric field); orange arrow = direction of the current; purple sphere = M1 target. B,C: Target locations in the same subject after the TMS coil was moved medially (B) and laterally (C) along the central sulcus to the TMS target area (hotspot) that produced perception blocking to cutaneous stimulation of the thenar skin area. In this subject, the actual distance was 12 mm medial (B) and 12 mm lateral (C). 12 mm is the distance between the maxima of the induced electric fields.