
Figure 4.
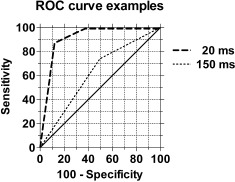
Receiver operating characteristic (ROC) curves for one subject. ROC curves were obtained by comparing the subject's responses to cutaneous test stimulation in experimental condition RR (real TMS with real cutaneous stimulation) vs. condition SR (sham TMS with real cutaneous stimulation). In this example, TMS was applied to the hotspot for the test site (thenar) in the S1 cortex 20 and 150 ms after the cutaneous test stimulus. The larger the area under the ROC curve (AUC), the larger the difference in discriminability of cutaneous test stimulation between the two experimental conditions; i.e., a large AUC indicates that detection of the cutaneous test stimulus is suppressed by real TMS when compared to detection of the same test stimulus during sham TMS. The diagonal line represents the baseline AUC value of 0.5 indicating no change in discriminability of test stimuli by real vs. sham TMS. For example, the curve for the interval of 20 ms in the graph was based on the following responses to real cutaneous test stimulation: 1) during real TMS, five “no,” two “maybe,” and one “yes” responses; 2) during sham TMS, one “maybe” and seven “yes” responses.